
nbc logo (2)
Office address
National Engineering Industries Ltd.
Khatipura Road Jaipur – 302006 Rajasthan, India
Phone Number

Toll Free: 1800 3000 6222
Telephone: +91 141 222 3221
Fax: +91 141 222 1926, 222 2259
CIN: U29130WB1946PLC013643

Top 10 Roller Bearings Manufacturers for Global Buyers?

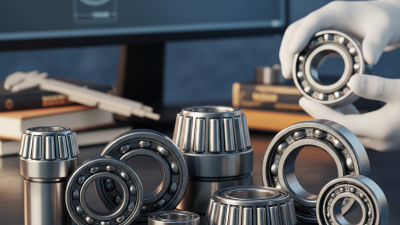
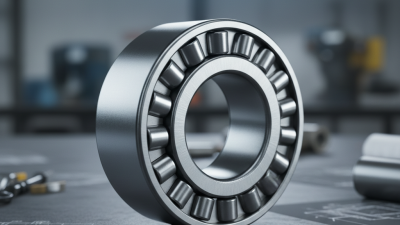
Roller bearings quietly carry enormous loads in factories, wind turbines, rail systems, and heavy vehicles. Inside a conveyor gearbox, a small defect can create heat, vibration, and costly downtime. Selection, therefore, requires more than comparing catalog prices. Price alone misleads.

Industry reports show why supplier quality matters. Grand View Research’s Ball Bearing Market Size, Share & Trends Analysis Report, 2024–2030, identifies automation, automotive production, and industrial machinery as important demand drivers. These sectors increasingly require tighter tolerances, longer service intervals, and consistent global supply. SKF’s Annual Report 2024 also describes uneven industrial demand across regions, alongside continuing pressure for energy efficiency and reliable equipment. Schaeffler’s Annual Report 2024 similarly emphasizes digitalization, electrification, and application-specific engineering.

This guide examines the Top 10 Roller Bearings Manufacturers for Global Buyers through practical purchasing criteria. The review considers product range, load capacity, material quality, sealing technology, certification, traceability, production scale, delivery capability, and technical support. It also considers how manufacturers respond when operating conditions change. Saltwater exposure, heavy shock loads, high temperatures, and misalignment each demand different designs.

No ranking is perfectly universal. A mining operator may value hardened steel and local inventory, while an electric-motor producer may prioritize low noise and precision. Some published market estimates also vary because researchers define “bearings” differently. That limitation deserves attention. The manufacturers discussed here are therefore evaluated as potential partners, not simply as famous brand names. For global buyers, dependable documentation, engineering communication, and verified performance often matter as much as the bearing itself.
Top 10 Roller Bearings Manufacturers for Global Buyers?

Global Market Snapshot: Demand Across Automotive, Industrial, and Energy Sectors

Demand for roller bearings is expanding across three distinct markets. OICA recorded more than 93.5 million motor vehicles produced globally in 2023. This volume supports steady demand for wheel hubs, transmissions, electric motors, and precision drivetrain systems. Automotive buyers now examine friction, noise, weight, and service life more closely.

Industrial demand is broader and less predictable. The International Energy Agency reports that industry consumed about 37% of global final energy in 2022. U.S. Department of Energy guidance also attributes roughly 70% of manufacturing electricity use to motor-driven systems. Pumps, compressors, conveyors, and gearboxes therefore create continuous bearing demand. A credible top-ten manufacturer shortlist should show testing data, load ratings, contamination resistance, and regional technical support. Marketing claims alone are insufficient.

Energy projects add another layer. The IEA recorded approximately 473 GW of new renewable power capacity in 2023. Wind turbines, hydroelectric equipment, and grid machinery require bearings that tolerate vibration, moisture, heavy loads, and long maintenance intervals. Yet rankings can be imperfect. A bearing performing well in a clean factory may struggle near saltwater or dust. Buyers should compare grease compatibility, sealing design, replacement access, and documented field experience. Total cost matters more than the purchase price. Sometimes, the cheapest component becomes the most expensive decision.
Ranking the Top 10: Revenue, Production Capacity, ISO Certification, and Reach

Top 10 Roller Bearings Manufacturers for Global Buyers

Ranking the top ten manufacturers requires more than comparing catalog size. Revenue indicates market strength, but it does not guarantee consistent bearing quality. Production capacity shows whether a supplier can support large orders without extending delivery schedules. During factory evaluations, buyers should examine machining lines, heat-treatment equipment, inspection rooms, and finished-goods storage.

ISO certification provides a useful reliability signal. Buyers should verify the certificate scope, issuing body, and renewal date. ISO 9001 supports quality management, while industry-specific systems may strengthen process control. Batch records, dimensional reports, and material certificates reveal more than a logo on a website. Small details matter. A clean inspection area often reflects disciplined production habits.

Global reach also deserves careful review. The strongest manufacturers maintain regional warehouses, technical service teams, and stable export procedures. Revenue figures can be difficult to compare because reporting periods and currency policies differ. Capacity figures may describe theoretical output, not practical availability. That weakness deserves attention. A factory claiming millions of units annually may still struggle with custom sizes or urgent replacement orders. Buyers should request recent lead-time data, sample inspection results, and references from comparable applications. This approach creates a more balanced ranking based on verified performance, not promotional language.

Top 10 Roller Bearings Manufacturers for Global Buyers? - Ranking the Top 10: Revenue, Production Capacity, ISO Certification, and Reach

Rank Manufacturer Latest Reported Consolidated Revenue Publicly Reported Manufacturing Footprint Production-Capacity Disclosure ISO 9001 Certification Product Coverage Global Reach Buyer Suitability
1 Manufacturer A Approximately €23.2 billion, FY2024 200+ production and development locations Unit capacity not publicly disclosed Yes; coverage varies by site Automotive, industrial, aerospace, wind energy, rail, robotics Global sales, engineering, and service network OEM and large industrial buyers
2 Manufacturer B Approximately ¥1.69 trillion, FY2024 More than 100 manufacturing sites and facilities Unit capacity not publicly disclosed Yes; certified facilities reported Automotive, steering, driveline, industrial, machine tools Strong presence across Asia, Europe, and North America Automotive and industrial OEMs
3 Manufacturer C Approximately ¥836.7 billion, FY2024 60+ manufacturing facilities and technical centers Unit capacity not publicly disclosed Yes; product and site certifications vary Automotive, industrial machinery, aerospace, construction equipment Distribution and manufacturing coverage in major industrial markets High-volume industrial buyers
4 Manufacturer D Approximately ¥815.5 billion, FY2025 40+ manufacturing plants and research facilities Unit capacity not publicly disclosed Yes; global site coverage is not uniform Automotive, precision machinery, semiconductor equipment, industrial bearings Established sales offices and distributors worldwide Precision and OEM applications
5 Manufacturer E Approximately SEK 94.8 billion, FY2024 70+ manufacturing sites and service locations Unit capacity not publicly disclosed Yes; certification depends on facility Wind power, heavy industry, mining, rail, automotive, energy Broad aftermarket and engineering support in 130+ countries Global distributors and MRO buyers
6 Manufacturer F Approximately US$4.6 billion, FY2024 40+ manufacturing facilities Unit capacity not publicly disclosed Yes; facility-level scope applies Industrial, aerospace, automotive, energy, transportation Global manufacturing and aftermarket distribution Heavy-duty and engineered applications
7 Manufacturer G Approximately ¥1.45 trillion, FY2025 30+ principal manufacturing facilities Unit capacity not publicly disclosed Yes; selected facilities publicly certified Miniature bearings, automotive, electronics, medical and precision equipment International production and supply chain network Miniature and high-precision buyers
8 Manufacturer H Approximately ¥245 billion, FY2024 20+ domestic and overseas production facilities Unit capacity not publicly disclosed Yes; certification is site-specific Bearings, robotics, hydraulic equipment, machine tools, automotive Primarily Asia-focused with international distributors Specialized industrial buyers
9 Manufacturer I Privately held; consolidated revenue not publicly disclosed Multiple large-scale production bases in China Detailed unit capacity not publicly disclosed ISO 9001 reported for manufacturing operations Automotive, industrial, agricultural machinery and standard bearings Strong China and Asia-Pacific reach with export channels Cost-sensitive volume buyers
10 Manufacturer J Approximately US$1.0 billion; reporting scope varies by fiscal year 10+ manufacturing and engineering locations Unit capacity not publicly disclosed Yes; selected production sites certified Aerospace, defense, space, medical, robotics and specialty bearings North America-centered with international project support Specialty and regulated industries
Data note: Manufacturer names are intentionally anonymized. Revenue figures represent the latest publicly reported consolidated fiscal-year revenue available for the corresponding manufacturer and may include non-bearing businesses. Comparable annual bearing-unit capacity is generally not disclosed by major manufacturers; therefore, the production-capacity indicator uses publicly reported manufacturing footprint and disclosure status as a transparent proxy. ISO 9001 certification normally applies to specific facilities or operating scopes rather than every site worldwide.

ISO 281 Benchmark: L10 = (C/P)^(10/3) Million Revolutions

Top 10 Roller Bearings Manufacturers for Global Buyers

ISO 281 Benchmark: L10 = (C/P)^(10/3) Million Revolutions

For global buyers comparing the top ten roller bearing manufacturers, ISO 281 offers a common technical language. Its basic benchmark is L10 = (C/P)^(10/3) million revolutions. C means the basic dynamic load rating. P is the equivalent dynamic bearing load. L10 predicts the life at which 90% of identical bearings may still operate. It is a statistical reference, not a promise. That distinction matters.

A buyer should request the C value, load assumptions, speed range, and calculation method. For example, a bearing rated at 100 kN under a 20 kN load gives a ratio of five. Its calculated L10 is about 427 million revolutions. At 600 rpm, that equals roughly 11,800 operating hours. Small changes in P can alter life sharply. This is where product tables deserve careful checking. Units can be mixed.

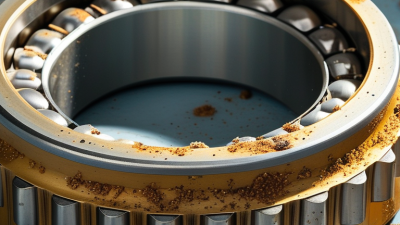
ISO 281 does not fully capture poor lubrication, contamination, electrical damage, mounting errors, or misalignment. A clean formula cannot rescue a dirty housing. Experienced engineers compare calculated life with grease condition, shaft deflection, sealing, and actual duty cycles. They also examine heat, vibration, and supply consistency when screening manufacturers. I would not select a supplier from L10 alone. Laboratory ratings may exceed workshop reality. That gap needs honest review. Ask for inspection records, traceability, and application support before approving a bearing.

Top 10 Roller Bearings Manufacturers for Global Buyers

ISO 281 Benchmark: L10 = (C/P)10/3 Million Revolutions

This benchmark uses ten load-ratio scenarios rather than company or brand data. C represents the basic dynamic load rating and P represents the equivalent dynamic bearing load. For roller bearings, ISO 281 uses an exponent of 10/3; therefore, a higher C/P ratio produces a longer calculated L10 rating life. L10 indicates the life at which 90% of an identical group of bearings are expected to survive under stated operating conditions.

Manufacturer Profiles: Product Range, Materials, Plants, and Regional Strengths

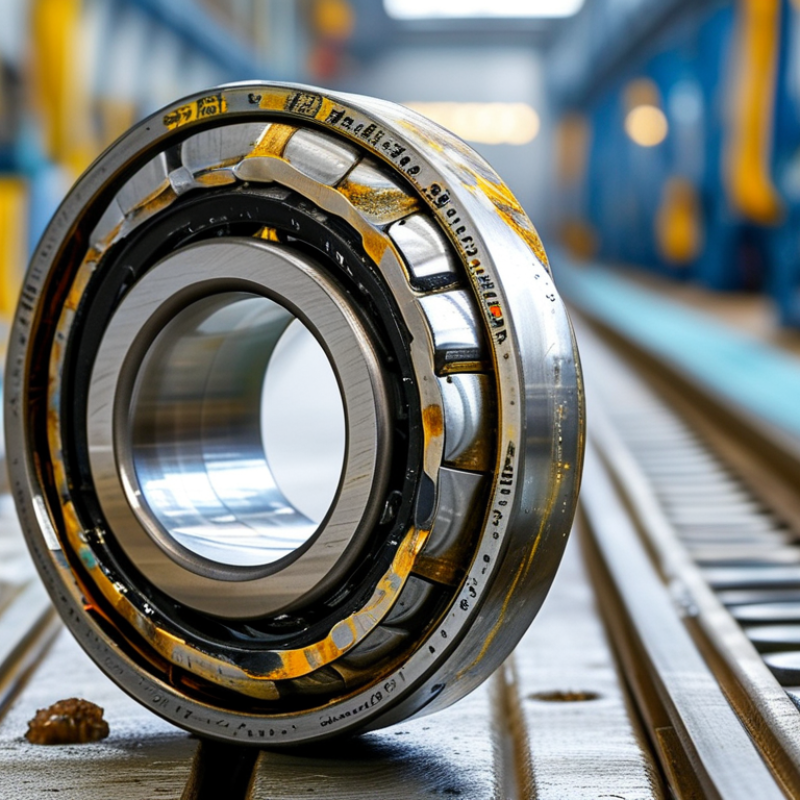
A useful manufacturer profile should show more than catalog size. It should explain product range, load capacity, speed ratings, and sealing options. Deep-groove, cylindrical, tapered, and spherical roller bearings serve different operating demands. Materials also matter. Standard chrome steel suits many industrial applications, while stainless steel supports humid or corrosive environments. Ceramic hybrids can reduce friction, but their higher cost needs clear justification. Plant details reveal production control. Look for forging, heat treatment, grinding, assembly, and inspection capabilities. Regional strengths may include faster delivery, local engineering support, or better knowledge of climate conditions. A polished brochure can still hide weak traceability. That deserves scrutiny.

Tips: Ask for material certificates, tolerance data, test reports, and batch identification. Compare plant locations with actual delivery routes. Check whether technical support covers your working language and time zone. Do not judge quality by price alone.

I have found that reliable suppliers explain failure modes without making perfect claims. They discuss lubrication, misalignment, vibration, and contamination risks. Their profiles should identify inspection equipment and quality procedures clearly. Export experience is useful, but regional compliance still requires verification. Some manufacturers offer broad ranges but limited customization. Others produce fewer designs with stronger application engineering. This difference can affect maintenance costs over years. I may overvalue factory scale when reviewing suppliers; responsiveness often matters more during an urgent shutdown. Ask for references from similar operating environments, not only impressive global projects.

Global Buyer Checklist: Tolerance Classes, MOQ, Lead Time, Warranty, and TCO

Top 10 Roller Bearings Manufacturers for Global Buyers?

A serious comparison starts with tolerance classes, not catalog photos. Check whether the supplier states ISO 492 tolerance grades and inspection methods. For high-speed equipment, tighter tolerance may improve running accuracy, but it can increase cost. Ask for measured data, not broad promises. In procurement reviews, I have found that unclear specifications often create more delays than manufacturing defects.

MOQ matters when demand is uncertain. A low MOQ can reduce inventory exposure, while a higher MOQ may lower unit pricing. Request samples before committing to a large order. Lead time should include production, inspection, packing, and transportation. Get each stage confirmed in writing. It sounds simple.

Warranty terms deserve careful reading. Confirm coverage duration, evidence requirements, replacement procedures, and exclusions for installation errors or contamination. A reliable manufacturer should provide traceability through batch numbers, material records, and inspection reports. These details show operational maturity.

Calculate total cost of ownership, not only the purchase price. Include freight, customs handling, storage, lubrication, installation, downtime, and replacement labor. A cheaper bearing may become expensive after repeated failures. Compare service life under your actual load, speed, temperature, and environment. I would also score communication quality, because slow answers can signal future support problems. My checklist is not perfect; regional logistics and changing forecasts can still disrupt a carefully planned purchase.