

Toll Free: 1800 3000 6222
Telephone: +91 141 222 3221
Fax: +91 141 222 1926, 222 2259
CIN: U29130WB1946PLC013643
Founded in 1946, National Engineering Industries Ltd (NEI) is India’s leading bearings manufacturer and exporter, renowned for excellence in quality and delivery.

Choosing a Polyester Yarn Machine is a production decision, not merely a purchasing exercise. The machine affects yarn quality, energy use, maintenance, labor, and delivery reliability. Textile Exchange’s Materials Market Report 2024 states that polyester represented about 57% of global fiber production in 2023. That scale creates strong competition. It also increases pressure to control waste and emissions.
Start with your actual production conditions. Check polymer type, spinning speed, denier range, filament count, and expected monthly output. A machine designed for high-speed POY may not suit FDY or specialty yarn production. Inspect the extruder, spinneret system, winding unit, temperature controls, and automatic doffing features. Small details matter. A faulty temperature sensor can create uneven yarn across an entire shift.
Textile machinery specialist Dr. Seshadri Ramkumar emphasizes a practical principle: “Technology must be evaluated through performance, cost, and sustainability together.” That principle should guide supplier comparisons. Review verified energy figures, spare-parts availability, training support, and service response times. ITMF’s International Textile Machinery Shipment Statistics also shows continuing investment in modern textile equipment, but shipment growth does not guarantee suitability for your factory. Reports describe market movement, not your floor layout.
Ask for trial data using your polymer and target specifications. Measure tenacity, elongation, hairiness, oil pickup, and package build. Then calculate total ownership cost over five to ten years. The cheapest quotation may become expensive through downtime. Perhaps your assumptions are wrong. Leave room for testing, operator feedback, and one uncomfortable question: can the factory maintain this machine consistently?
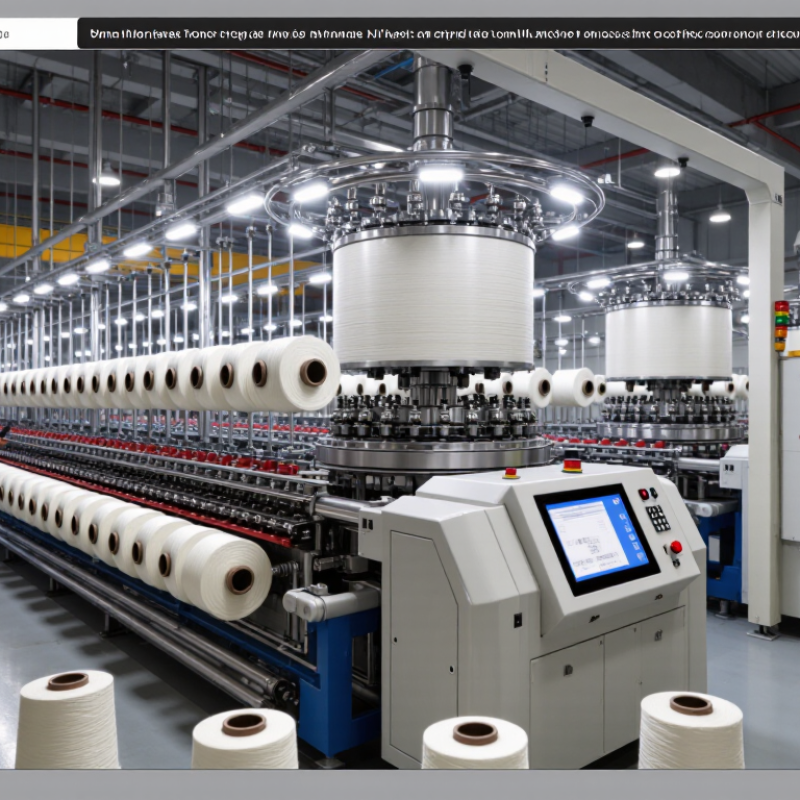
Textile Exchange’s Materials Market Report 2024 records 124 million tonnes of global fiber production in 2023. Polyester represented 57%, or roughly 71 million tonnes. This scale matters when selecting a polyester yarn machine. Demand is broad, but factory conditions are never identical.
Match the machine to your yarn plan, not only its catalogue speed. Check denier range, filament count, draw ratio, texturing method, and compatible recycled inputs. A 150-denier filament line may need different tension control than a fine 75-denier line. Ask for measured energy use per kilogram, temperature stability, waste percentage, and changeover time. These figures reveal more than a maximum output claim.
Use Textile Exchange’s fiber data as a market signal, then compare it with ITMF machinery shipment statistics and your sales forecast. A machine running 24 hours daily needs reliable heat control, accessible filters, and simple maintenance points. Inspect one operating line if possible. Listen for vibration near the winding unit. Look for uneven packages.
Do not assume polyester’s 57% share guarantees easy sales. It does not. Product differentiation, recycled-content requirements, and electricity costs can change the calculation. A neat spreadsheet may still mislead. Leave capacity for trials, faults, and slower orders. That is less impressive on paper, but more realistic on the factory floor.
Global fiber production reached 124 million tonnes in 2023. Polyester represented 57% of total production, equal to approximately 70.68 million tonnes, indicating the significant scale of polyester yarn demand.
Data source: Textile Exchange, 2023 global fiber production total of 124 million tonnes and polyester share of 57%. Other fibers are calculated as the remaining 43%.
Global fiber output may approach 160 million tonnes by 2030, according to industry forecasts. This growth could increase demand for polyester yarn in apparel, home textiles, automotive fabrics, and technical materials. However, the figure is a projection, not a promise. Factory owners should test local demand before expanding capacity.
When choosing a polyester yarn machine, match production speed with your actual order pattern. A machine running at 1,200 meters per minute may look attractive, but unstable orders can leave expensive equipment idle. Check denier range, filament count, heating control, winding accuracy, and energy use. During factory evaluations, ask operators to inspect yarn tension after several hours, not only during a short demonstration.
Energy consumption matters more as output rises. A small efficiency difference can become costly across thousands of operating hours. Reliable temperature sensors, accessible maintenance points, and clear fault records also protect production quality. Leave room for future upgrades, but avoid paying for features your team cannot maintain. This is where many purchasing plans become too optimistic. A lower-cost machine may still be suitable if its spare parts, training, and service response are dependable. Request test runs using your planned polymer and target yarn specification. Then compare strength, elongation, evenness, waste, and restart time under realistic factory conditions.
How to Choose a Polyester Yarn Machine for Your Factory?
Select the Process: POY, FDY, DTY, or Staple Fiber by End Use
Your end product should guide the machine choice, not the machine brochure. POY equipment suits factories supplying partially oriented yarn for later texturing. It offers flexible denier control and supports high-volume production. Check winding stability carefully. Uneven packages can create trouble during downstream processing.
FDY machines produce fully drawn yarn with a smoother, more stable structure. This option fits fabrics needing clean surfaces, consistent strength, and low shrinkage. It demands accurate temperature control and reliable godet settings. Small process changes can affect dye uptake.
DTY equipment adds crimp, stretch, and bulk to polyester yarn. Choose it for sportswear, upholstery, socks, and soft furnishing fabrics. Test different texturing speeds before fixing your production plan. A glossy sample may still perform poorly after repeated washing. That lesson is easy to miss.
Staple fiber lines cut polyester into short lengths for spinning, nonwoven materials, or filling products. They require attention to fiber length, crimp, oil finish, and cutting precision. Review your target customer’s specifications before selecting capacity. I would also compare energy use, maintenance access, and operator skill requirements. The cheapest machine may become expensive when cleaning takes too long. No selection is perfect. Conduct a material trial, record actual output, and leave room for process adjustment.
How to Choose a Polyester Yarn Machine for Your Factory?
Specify Performance: Apply ISO 2060 for Yarn Linear-Density Testing
Choosing a polyester yarn machine should begin with measurable yarn performance. ISO 2060 provides a practical method for testing linear density, commonly expressed in tex. A machine may run quickly, but unstable yarn weight can create dyeing problems and fabric defects. Ask suppliers how the machine controls tension, winding speed, and package formation. These details directly influence test results.
In production, collect yarn samples from different packages and machine positions. Condition them before testing, then prepare skeins with controlled length and tension. Use a calibrated balance and record the specimen mass carefully. The calculated tex value reveals whether the machine produces consistent yarn. Keep the test temperature and humidity stable. Small environmental changes can affect moisture-sensitive polyester measurements.
I once trusted an attractive output figure too quickly. That assumption was wrong. The machine produced good-looking packages, but test variation increased during longer runs. A better evaluation compares repeated ISO 2060 results, not one successful sample. Review the average value, range, and unusual readings with production staff. Also inspect broken filaments, uneven winding, and tension alarms. Perfect consistency is unlikely. Honest testing exposes weaknesses before customers do.
How to Choose a Polyester Yarn Machine for Your Factory?
The purchase price is only the visible part of a polyester yarn machine. Measure electricity in kWh per kilogram, not only motor capacity. The International Energy Agency reported that industry used about 37% of global final energy in 2022. Small efficiency losses can therefore become significant factory costs. Record output during a full shift, including warm-up, doffing, cleaning, and short stops. A machine producing 1,000 kilograms daily may look efficient. It may not be.
Throughput must be checked beside OEE. The U.S. Department of Energy identifies 85% OEE as a common world-class reference, although real textile lines often perform lower. Calculate availability, performance, and quality separately. Ask for verified production data, not optimistic demonstrations. Maintenance matters too. Compare lubrication intervals, spare-part lead times, technician hours, and planned downtime. A cheaper machine with frequent sensor faults can quietly erase its price advantage. We learned this the hard way.
Compliance also belongs in the total-cost model. Check energy monitoring, guarding, noise control, emissions documentation, and local electrical requirements before ordering. Textile Exchange reported polyester accounted for approximately 57% of global fiber production in 2023, increasing pressure to document material efficiency and recycled content. Include waste kilograms, rejected packages, and restart losses in your calculation. Leave room for uncertainty. Factory conditions rarely match brochures. Recheck the figures after three months.
| Evaluation Dimension | Indicative Machine Configurations | |||
|---|---|---|---|---|
| Standard POY Line 96 positions | High-Throughput POY Line 144 positions | FDY Line 96 positions | Energy-Optimized POY Line 144 positions | |
| Production and Utilization | ||||
| Typical yarn application | General-purpose partially oriented yarn | High-volume commodity POY | Fully drawn yarn for downstream textile use | High-volume POY with enhanced heat recovery |
| Rated line throughput | 480 kg/h | 650 kg/h | 420 kg/h | 600 kg/h |
| Planned operating time | 8,000 h/year | 8,000 h/year | 8,000 h/year | 8,000 h/year |
| Expected OEE | 78% | 82% | 80% | 84% |
| Estimated saleable output | 2,995 t/year | 4,264 t/year | 2,688 t/year | 4,032 t/year |
| Changeover and grade flexibility | Medium; suitable for regular product families | Medium; best with long production campaigns | High; more process variables and quality controls | Medium to high; suitable for stable, high-volume products |
| Energy and Operating Cost | ||||
| Specific electricity consumption | 1.55 kWh/kg | 1.35 kWh/kg | 1.70 kWh/kg | 1.25 kWh/kg |
| Estimated annual electricity use | 4.64 GWh | 5.76 GWh | 4.57 GWh | 5.04 GWh |
| Annual electricity cost At USD 0.09/kWh | USD 417,800 | USD 518,000 | USD 411,300 | USD 453,600 |
| Estimated annual labor cost Shared three-shift staffing model | USD 420,000 | USD 420,000 | USD 450,000 | USD 420,000 |
| Estimated annual maintenance cost | USD 65,300 | USD 78,000 | USD 80,000 | USD 68,000 |
| Maintenance cost as a percentage of equipment value | 4.5% | 4.0% | 5.0% | 4.0% |
| Investment and Total Cost of Ownership | ||||
| Indicative equipment purchase price | USD 1,450,000 | USD 1,950,000 | USD 1,600,000 | USD 2,100,000 |
| Installation, commissioning, and training allowance | USD 180,000 | USD 240,000 | USD 200,000 | USD 260,000 |
| Estimated five-year total cost of ownership | USD 6.49 million | USD 7.15 million | USD 6.48 million | USD 7.00 million |
| Five-year TCO per kg of saleable yarn | USD 0.43/kg | USD 0.34/kg | USD 0.48/kg | USD 0.35/kg |
| Estimated payback priority | Lower initial investment and moderate risk | Best for maximum volume and lowest unit cost | Best when FDY capability commands a product premium | Best where energy prices or carbon targets are high |
| Reliability, Maintenance, and Quality | ||||
| Recommended preventive maintenance interval | Monthly inspection; quarterly planned service | Monthly inspection; quarterly planned service | Monthly inspection; more frequent draw-unit checks | Monthly inspection; quarterly planned service |
| Critical spare-parts exposure | Moderate | High due to greater position count and output | High due to draw rolls and control components | Moderate to high |
| Expected technical availability | 90% | 92% | 91% | 93% |
| Process-control requirement | Temperature, pressure, spinning speed, and winding tension | Advanced tension, temperature, and position monitoring | Advanced draw-ratio, roller-temperature, and tension control | Integrated energy, temperature, tension, and alarm monitoring |
| Quality risk during ramp-up | Medium | Medium to high | High | Medium |
| Compliance and Factory Integration | ||||
| Machine safety documentation required | Risk assessment, guarding, emergency stops, electrical drawings | Risk assessment, guarding, emergency stops, electrical drawings | Risk assessment, guarding, emergency stops, electrical drawings | Risk assessment, guarding, emergency stops, electrical drawings |
| Environmental control considerations | Ventilation, heat removal, noise control, and polymer-fume management | Higher heat load and ventilation capacity required | Higher heat load, noise, and process-exhaust requirements | Heat-recovery integration and energy monitoring recommended |
| Electrical and utility requirements | Medium power demand; standard industrial cooling loop | High power demand; larger transformer and cooling capacity | Medium to high power demand; precise cooling control | High power demand; heat-recovery and monitoring interfaces |
| Data and traceability capability | Basic production and alarm records | Advanced production, alarm, and OEE records | Advanced quality and process traceability | Advanced OEE, energy, alarm, and traceability records |
| Compliance readiness | Suitable when supplier documentation is complete and site risks are closed | Suitable; requires stronger validation of guarding and electrical systems | Suitable; requires additional process-safety and exhaust review | Suitable; verify energy-monitoring and heat-recovery documentation |
| Recommended Selection Scenario | ||||
| Best-fit factory profile | Medium-sized factory seeking balanced investment and flexibility | Large factory with stable demand and strong technical staffing | Factory targeting higher-value fully drawn yarn products | Factory with high electricity costs or measurable carbon-reduction goals |
| Primary advantage | Lower entry cost and simpler operation | Highest annual output and strong unit economics | Greater downstream product capability | Lowest specific energy consumption and high OEE potential |
| Main trade-off | Lower output and higher cost per kilogram | Higher capital cost and more complex maintenance | Higher process complexity and maintenance sensitivity | Highest initial investment and dependence on stable utilization |
| Basis of comparison: Illustrative engineering estimates for a three-shift operation running 8,000 hours per year. Saleable output is calculated as rated throughput × operating hours × OEE. Five-year TCO includes equipment purchase, installation allowance, electricity, labor, and preventive maintenance; it excludes financing, depreciation, raw materials, buildings, taxes, freight, and production revenue. Electricity cost is modeled at USD 0.09/kWh. Actual values should be validated through a supplier technical proposal, factory utility audit, product specification review, and local compliance assessment. | ||||
Copyright © 2023 NEI Ltd. All rights reserved.
Registered Office : 9/1, R. N. Mukherjee Road, Kolkata – 700 001. In case of any queries or grievances, please contact Mr.Tarun Kumar Kabra, Company Secretary.
E-mail: sale@kinpart.com Privacy Policy Cookie Policy